How Do We Group Shorts Videos by Similar Topic?
When you scroll through Shorts, videos with a similar feel sometimes appear one after another. But what makes two videos "similar"?
"If a user watches an entire podcast featuring Tablo, what should we show next?"
That was our first question as we made Langflix's Shorts recommendations more personal. To show different videos to different users, we need to describe what kinds of videos each user likes. Before that, we need a way to group videos by kind.
Defining those kinds is harder than it sounds. Are videos similar because they come from the same channel? Because they share a tag? Neither was sufficient, so we chose to turn the content itself into vectors and group those.
Hello! I'm Taesoo Song, and I helped build the Langflix Shorts recommendation system at Theta One.
Today I'll describe content clustering, one of the foundations of that system.
In this work, we:
- represented each video with a weighted average of embeddings for its title, subtitles, and synopsis instead of its channel or tags;
- found why cosine-based Spherical K-Means was a better fit than Euclidean-distance clustering; and
- improved explanatory power by 16% by assigning weighted top-three clusters instead of only one.
Three ways to define a "similar video"
We considered three main ways to group videos.
- Group by channel
This is the easiest and most intuitive approach: assume videos from the same channel are similar. In our measurements, channel-based grouping explained responses with an R² of about 0.235. It was a reasonable starting point, but a channel may cover many topics, while different channels may discuss essentially the same thing. - Group by topic tag
Videos already had tags such asdaily,entertainment, andnews. But a human-defined tag set has a fixed number of categories and blurry boundaries. One tag cannot capture enough about a video that spans several topics. - Group by the content itself
This is what we chose. Instead of putting videos into predefined boxes, we let similar content find its own groups.
One video, one vector
We had three usable text fields for each video: title, subtitles, and synopsis. We could concatenate them before embedding, but hundreds of characters of subtitles would overwhelm a short title. Instead, we embedded the fields separately and took a weighted average.
We gave subtitles the largest weight, 0.5, because they contain what the video actually says. We gave the synopsis only 0.1, because it came from the source video's description and often contained subscription requests or hashtags rather than useful content.
The surprise was the channel name. It is a strong signal, but mixing it into the content vector made the clusters look much like a list of channels. We therefore left it out of the content vector and kept it as a separate feature.
Preprocessing also differed by field. We left titles alone; for subtitles, we replaced <br/> tags with spaces and cleaned up brackets, music symbols, and speaker labels. For synopses, we removed URLs, email addresses, social handles, and subscription prompts. These small changes made a substantial difference to cluster quality.
Why group by direction rather than distance?
This is where we got stuck for a while. Ordinary K-Means groups points using Euclidean distance, but text embeddings are generally compared using cosine similarity, or vector direction.
The distinction matters. After taking a weighted average of three fields, vectors have different lengths. That length has little to do with topic; it reflects how closely the fields agree with one another.
A longer subtitle can make the vector for a Tablo video longer. By Euclidean distance, an unrelated news video could then appear closer than another Tablo video with shorter subtitles. Serving would use cosine similarity to retrieve videos anyway, so the clustering and retrieval criteria would disagree.
We therefore centered the vectors at the mean and L2-normalized them onto the unit sphere, then clustered them with cosine-based Spherical K-Means. Despite the imposing name, the core change is simple: L2-normalize the centroids again after each iteration.
X = normalize(X - X.mean(axis=0))          # Mean centering, then L2 normalization

for _ in range(max_iter):
    sims = X @ centroids.T                  # For normalized vectors, dot product = cosine similarity
    labels = sims.argmax(axis=1)
    for k in range(K):
        centroids[k] = X[labels == k].mean(axis=0)
    centroids = normalize(centroids)        # Return averaged centroids to the unit sphere
How many clusters should we use?
There is no single correct value of K. We asked, "How much of a video's response can cluster information alone explain?" We compared the explanatory power (R²) of predicting video response scores from cluster labels for different values of K.
| Number of clusters K | R² |
|---|---|
| 10 | 0.187 |
| 25 | 0.192 |
| 50 | 0.222 |
| 100 | 0.203 |
K=50 worked best. The drop at 100 matters: when clusters become too small, there are too few videos in each to support a meaningful description of that cluster. With K=50, clusters contained roughly 28 to 216 items each.
Must a video belong to only one cluster?
We also tried a soft assignment: give each video weights for its three nearest clusters rather than forcing it into just one.
| Assignment method | R² |
|---|---|
| Channel-based grouping (baseline) | 0.235 |
| Hard assignment (one cluster) | 0.222 |
| Soft top-three (three weighted clusters) | 0.257 (+16%) |
| Soft top-three plus channel grouping | 0.261 |
The result makes intuitive sense. The Tablo video in our opening example is both a podcast and a celebrity interview. Some viewers may like the podcast format; others may watch for Tablo. Forcing it into one cluster discards one of those signals.
Adding channel grouping to the soft top-three barely raised R², to 0.261. The clusters already captured much of the channel information. We ultimately used a 562-dimensional item feature: a 512-dimensional text vector joined with a 50-dimensional cluster vector.
Assigning new videos to clusters
New Shorts keep arriving, sometimes as many as 1,000 in a week. We had 1,649 videos on June 26 and 8,429 by August 23, a fivefold increase in two months.
If clusters stayed fixed throughout that growth, new topics would be forced into old clusters. But retraining on every new video was not practical. We set explicit criteria:
- Normally
Embed a new video and assign it by cosine similarity to existing centroids (one hard assignment and a soft top-three). - Retraining conditions
At least 1,000 new embeddings and at least 14 days since the last retraining. Both conditions must hold. - After retraining
Revisit K using cosine silhouette, leave-one-out R², and cluster size distribution; review cluster quality; reassign all videos; then activate the new version.
We added an admin monitoring page so we could make those decisions with evidence. It shows new-video growth, changes in average centroid distance, and the soft-assignment distribution in one place.
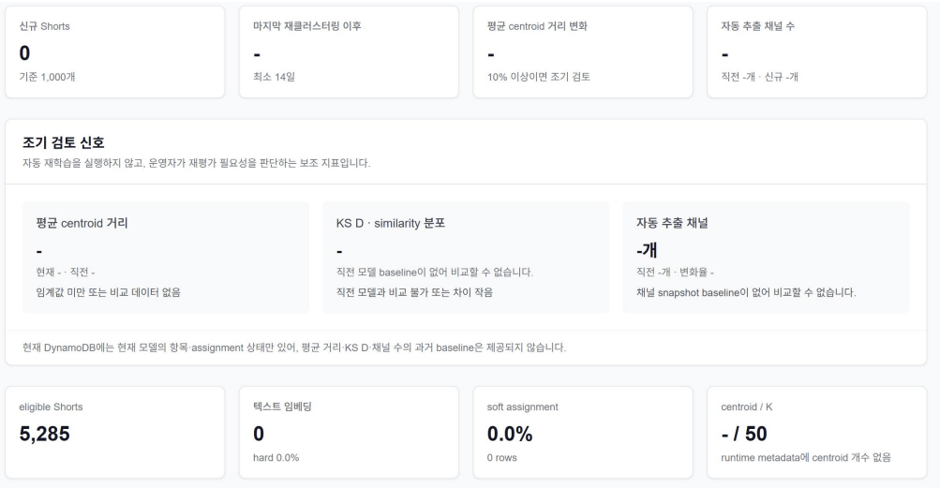
Adding response scores by cluster revealed an unexpected use: which topics need more videos.
- Strong response but few unexposed videos left → prioritize sourcing
- Strong response but exposure concentrated on a few videos → prioritize rotation
The clusters we built as recommendation features also became a tool for deciding what content to source.
Conclusion
The central idea was to let the content itself define what "similar" means.
Channels and tags are predefined boxes, and content rarely fits them perfectly. Turning videos into embeddings and grouping them by direction produced clusters with more explanatory power than channel-based grouping. Allowing weighted top-three assignments improved it again.
What I will remember most is that a feature built for recommendations also helped us make content-sourcing decisions. A useful intermediate representation can find value beyond its original purpose.
Reflections
Eight long weeks have come to an end. I want to thank the Theta One staff for giving our Growth Hackers team access and so many opportunities to learn. I got hands-on experience with tools such as Supabase and PostHog that I had not been able to use before.
I also learned a little more about how people collaborate on development, share their work, and move forward together. I believe Langflix will become much better known, and I'll do my best to spread the word!
You can learn English with your favorite YouTube and Netflix videos in Langflix, available on the App Store and Play Store.
Thank you for reading!